Distance from the crowds does not protect the value of an investment. Kintamani, where we are building, is 78 km from the airport and Airbnb occupancy there is 23.9% (AirROI, 5 Nov 2026). Two other things do: a view that is hard to copy, and a reason to come to that particular place. The crowded south doesn’t win either. It has fewer listings than a year ago, and revenue per listing is down 13–18%.
This is part two of a series on how the Nord Nest model took shape. Part one is “Boutique hotel vs villa: how to invest in a Bali hotel”. “Further from the crowd means safer” is a comfortable idea, but the data doesn’t support it.
Where to buy property in Bali: what happened to the south
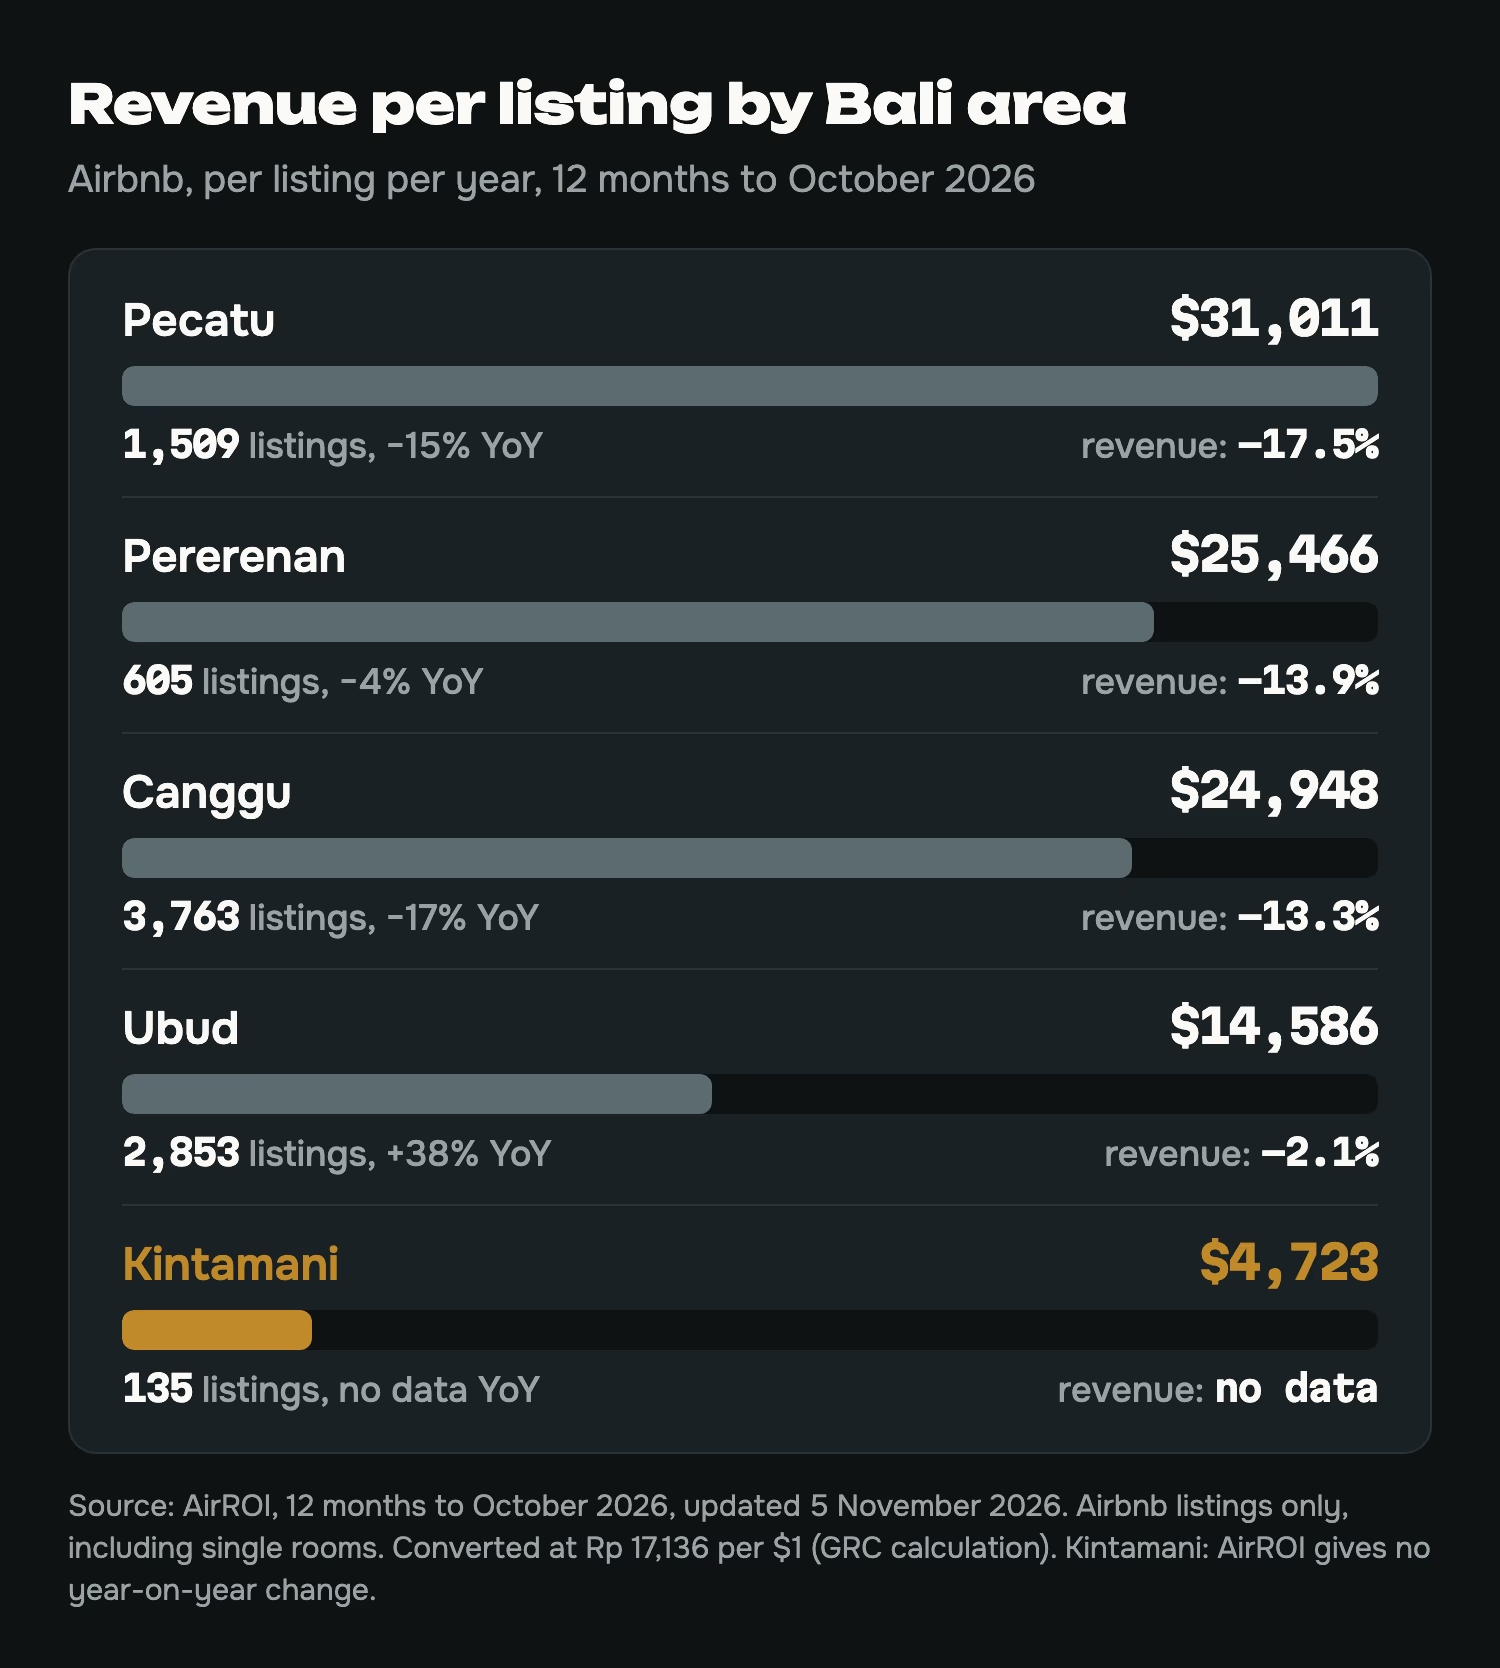
We took the AirROI data for Bali areas for the year to October 2026.
| Area and change over the year | Listings | Occupancy | Revenue per year |
|---|---|---|---|
| Canggu: listings −17%, revenue −13.3% | 3,763 | 38.1% | $24,948 |
| Pererenan: listings −4%, revenue −13.9% | 605 | 42.2% | $25,466 |
| Pecatu: listings −15%, revenue −17.5% | 1,509 | 43.1% | $31,011 |
| Ubud: listings +38%, revenue −2.1% | 2,853 | 39.1% | $14,586 |
| Kintamani: no change reported | 135 | 23.9% | $4,723 |
AirROI, the year to October 2026, pages updated 5 Nov 2026. Airbnb only. Revenue is per listing; rupiah converted to dollars at the page rate, Rp 17,136 per $1.
In Canggu, Pererenan and Pecatu the number of listings fell, and revenue per listing dropped 13–18%. Ubud is growing: 38% more listings, with revenue per listing roughly flat. Revenue per listing is falling across most of the island: in the AirROI index it fell in 29 of the 33 areas with comparable data, by 12% in the typical one.
AirROI doesn’t say why listings disappeared, and we won’t guess. The service updates its numbers, so everything here is the 5 Nov 2026 snapshot, and it may differ from the figures in our piece on villa yields in Bali.
Is there a building moratorium in Bali? What was actually banned
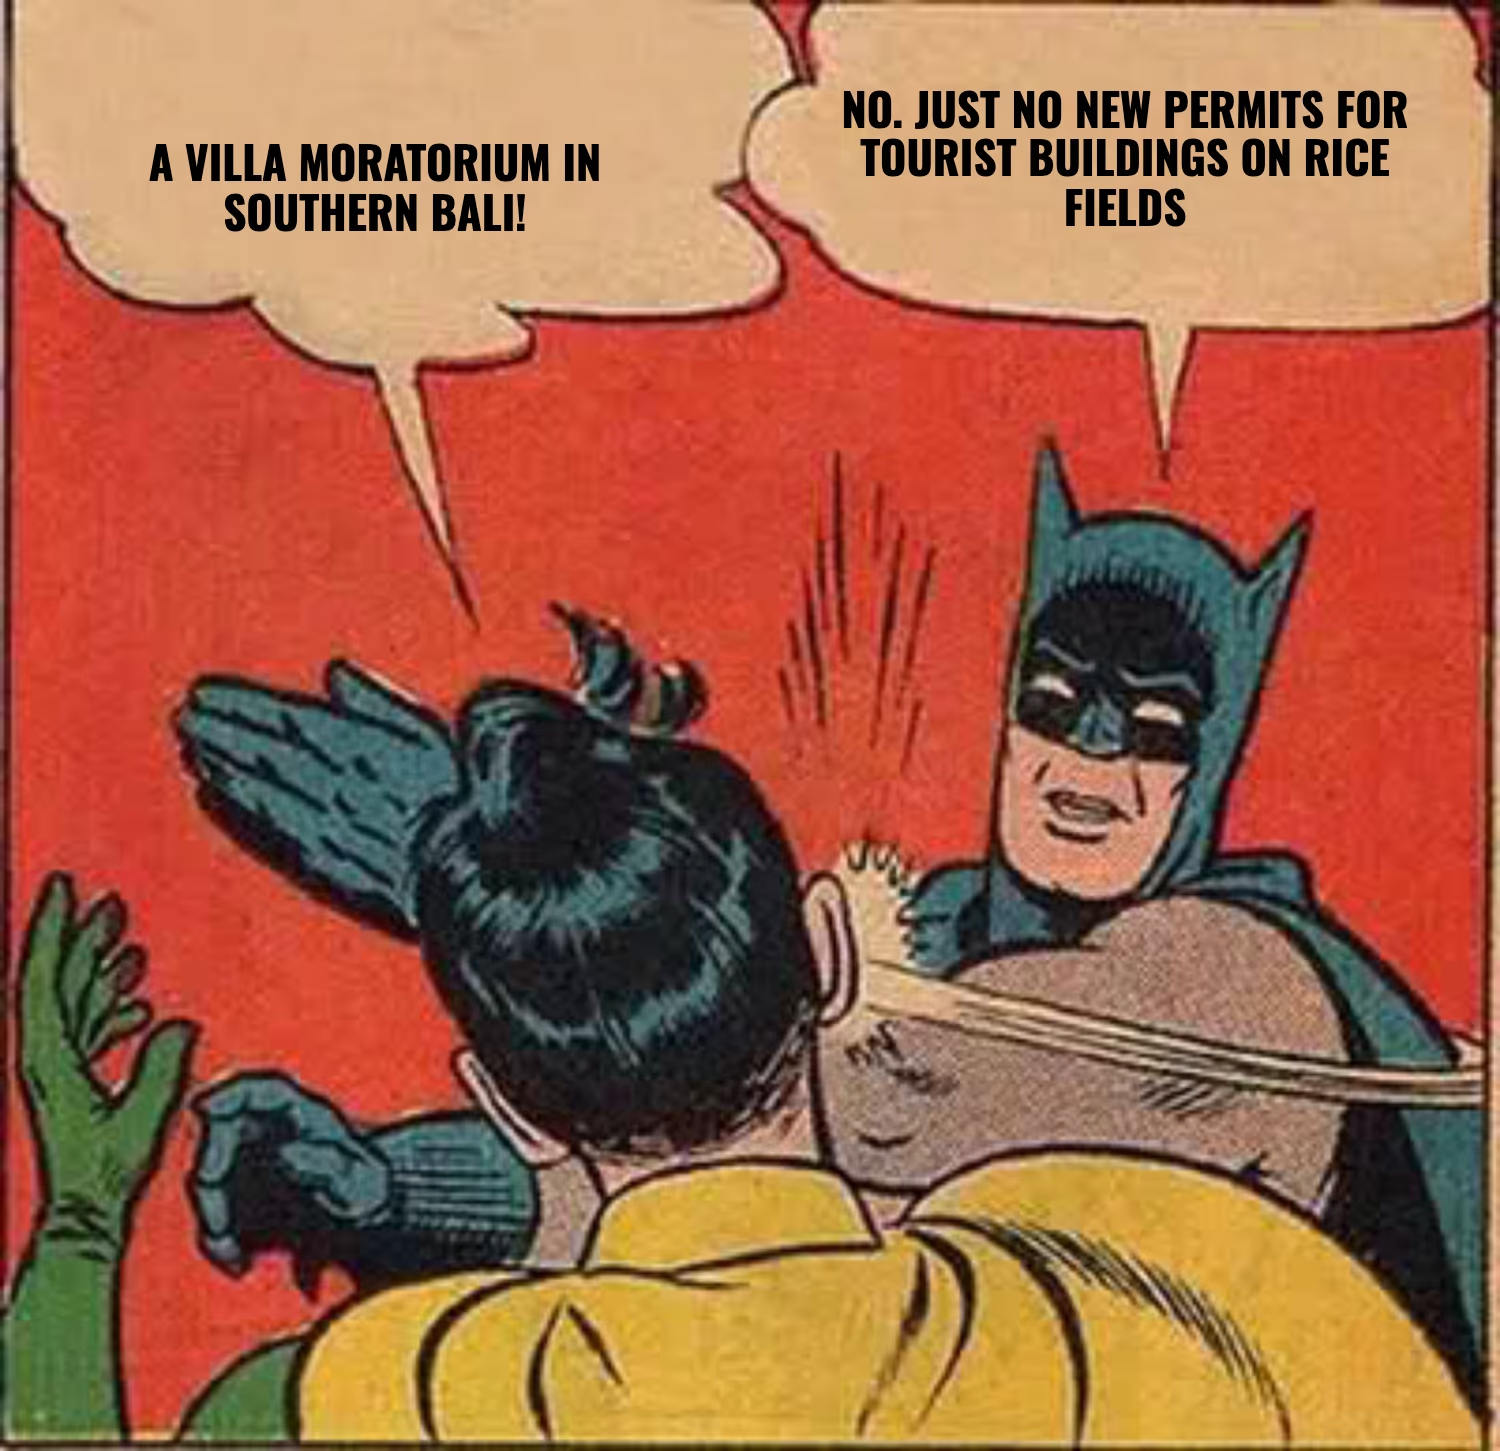
You can still build villas in southern Bali. A moratorium on new villas and hotels in key resort areas such as Canggu, Seminyak and Nusa Dua was proposed, but in January 2025 the governor dropped it: “There is no need for a moratorium. What’s needed is stricter control.” (Skift, 17 Jan 2025)
The ban covers something else. From 2025 the provincial authorities stopped issuing permits for tourism properties on productive land, meaning rice fields and similar plots (Antara Bali, 28 Jul 2025). After the September 2025 floods the Bali governor repeated the ban (Jakarta Post, 17 Sep 2025). Antara cites the document as Bali Governor’s Instruction No. 5 of 2025 (27 Aug 2026).
The ban follows the land type, not the district, so it applies to the south, the north and Kintamani alike. We found no measurement of what it did to prices of finished properties; “existing villas gain value because nothing new gets built” remains a hypothesis. We found no legal protection for a view as such: whether the neighbouring plot gets built on depends on its category and zoning.
How much is a view worth? What the research says
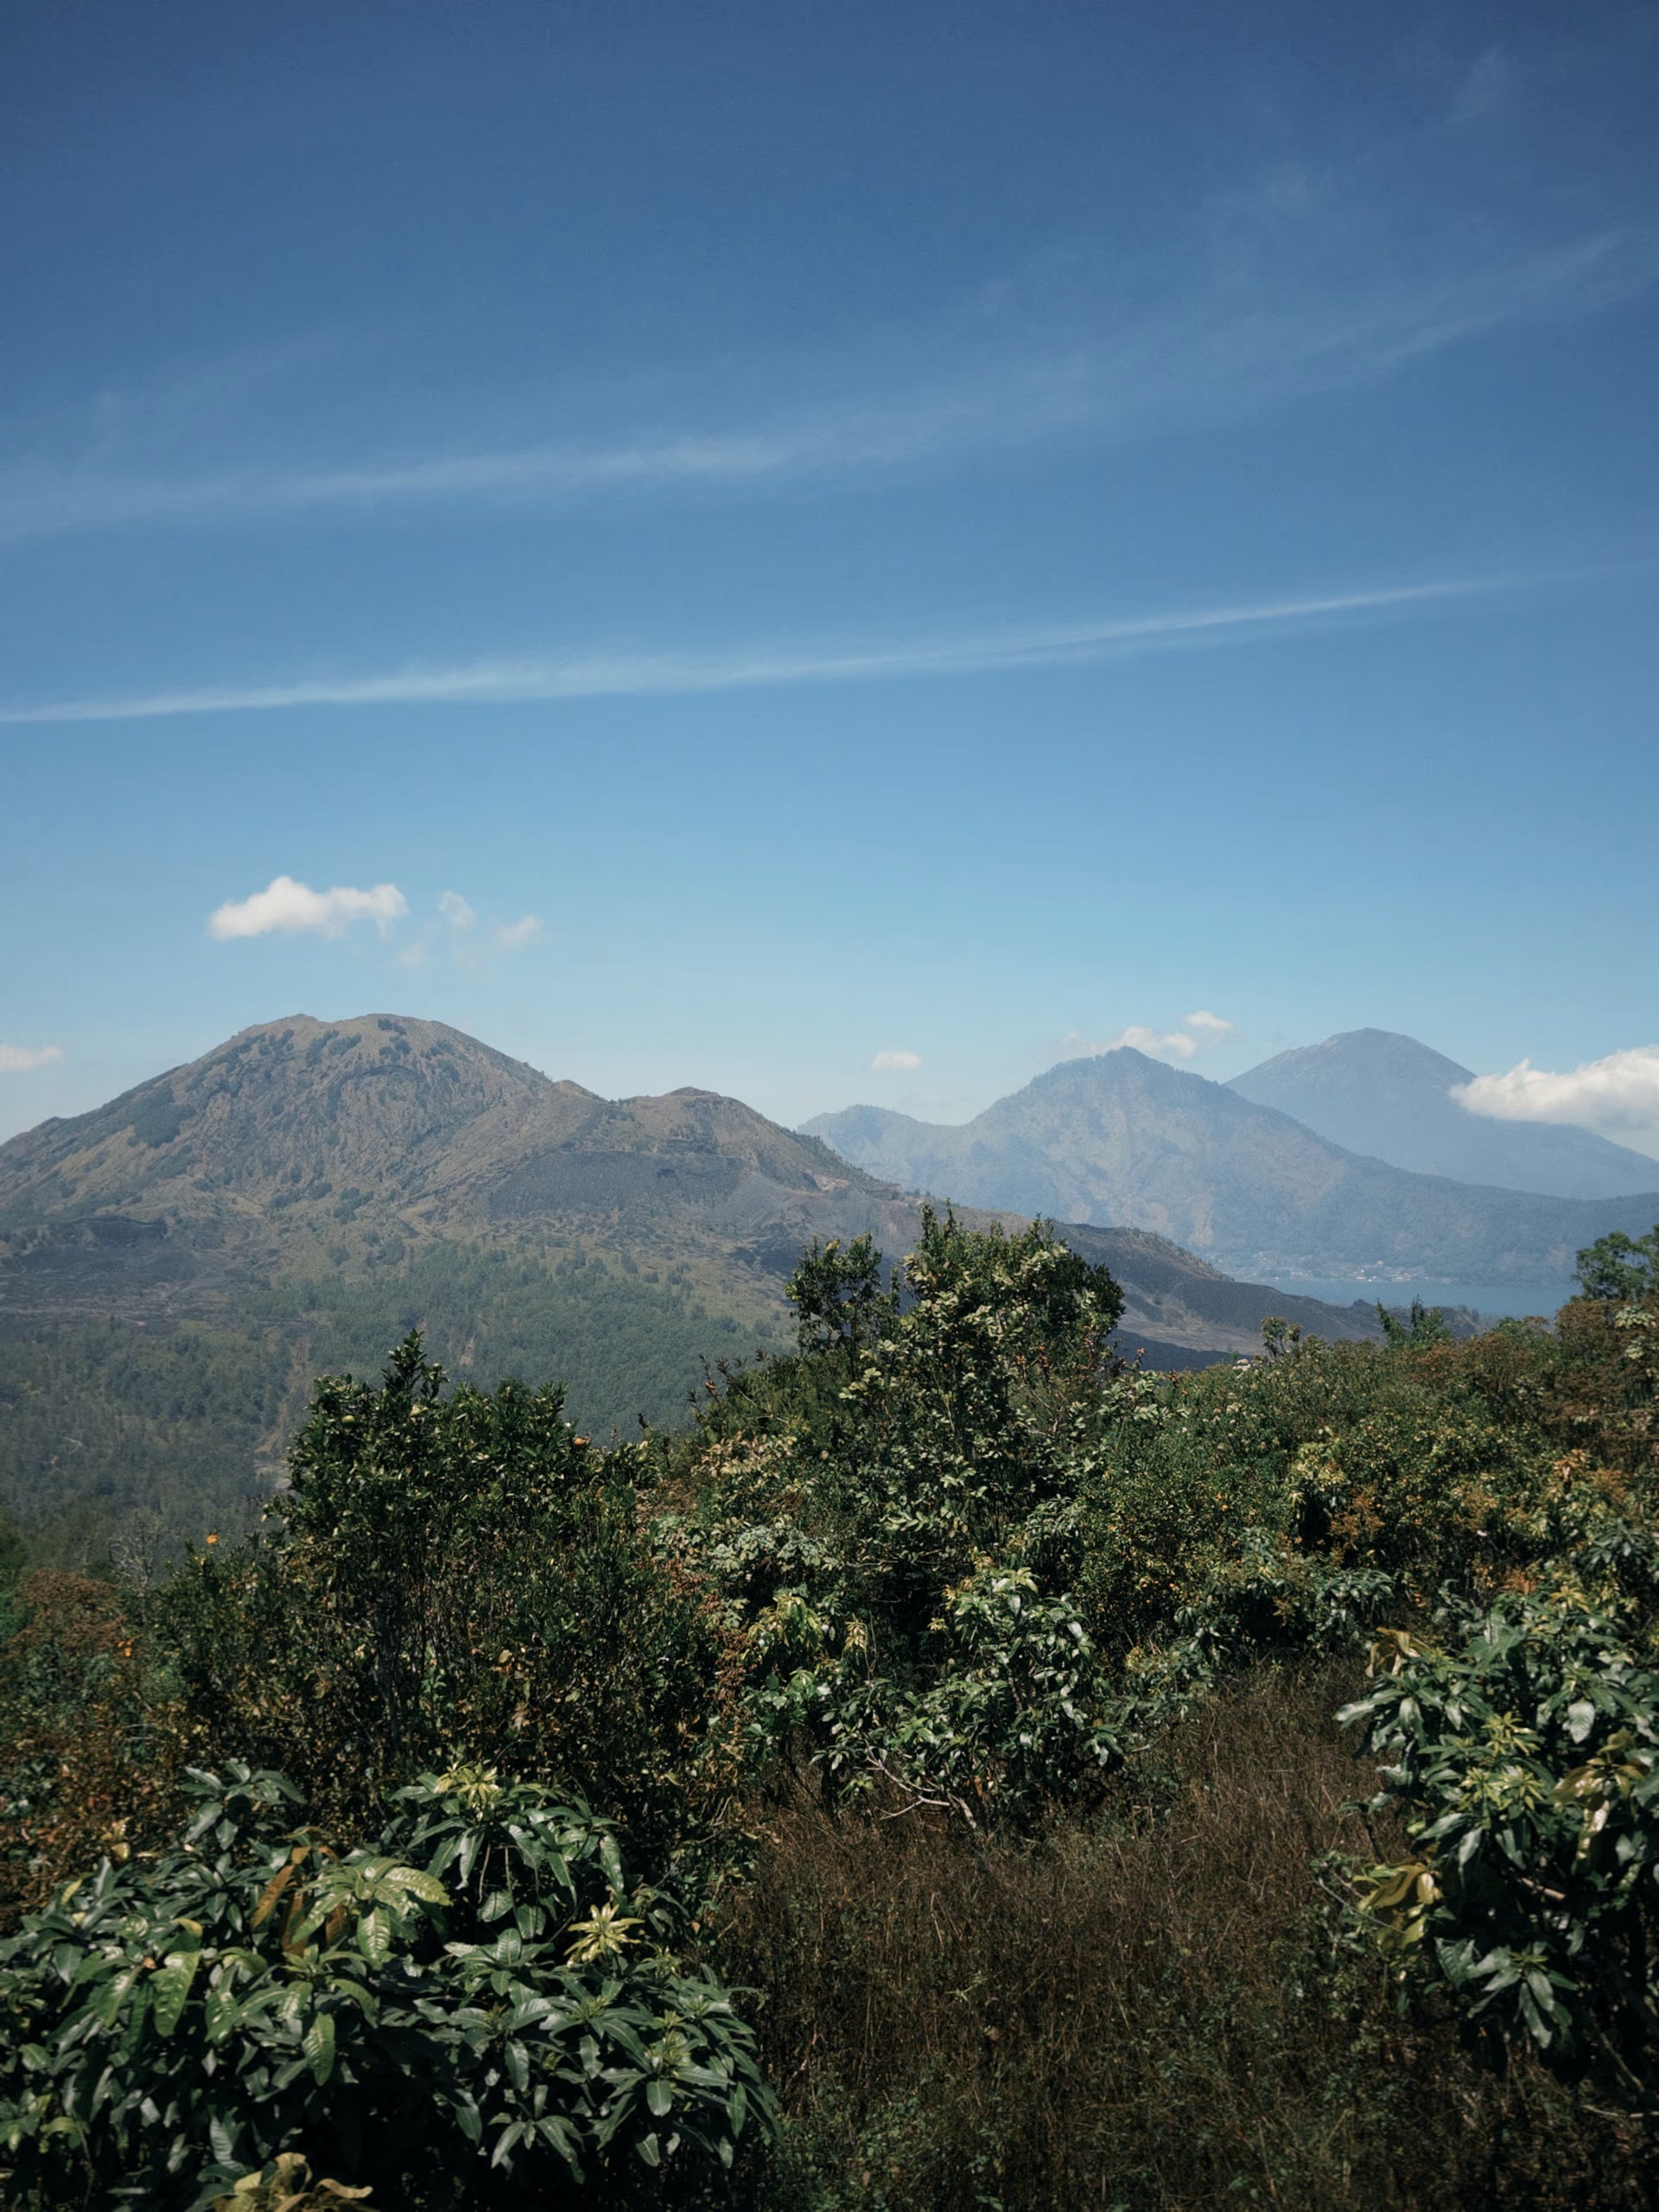
We found no studies about volcanoes. There are some about water:
- Mediterranean, 2012 (Fleischer, Tourism Management): a sea-view room costs about 10% more. The sample was about 2,800 rooms on Booking.com.
- Quebec, 2024 (Dubé et al.): a view of the St. Lawrence River carries a premium of 0 to 20%, and on the south shore it swings widely.
- Bellingham, USA, 1998 (Benson et al.): the best ocean view lifts a house price by almost 60%. A view of snow-capped mountains adds 8.9%, but it isn’t statistically significant.
Water views pay: about 10% on a hotel room, up to 60% on a house. For mountains, the one study we found shows no clear premium. We found no data on what a view of Batur is worth, so we won’t quote a percentage and look at market occupancy instead.
The price of remoteness: 78 km to the airport, 23.9% occupancy
From Penelokan (Kintamani) to Ngurah Rai airport it is 78 km and about 71 minutes without traffic. From Canggu it is 20 km and 26 minutes, from central Ubud 37 km and 36 minutes (OSRM routing on OpenStreetMap data, 6 Nov 2026). We haven’t timed the drive or counted traffic, so in season the gap is probably smaller.
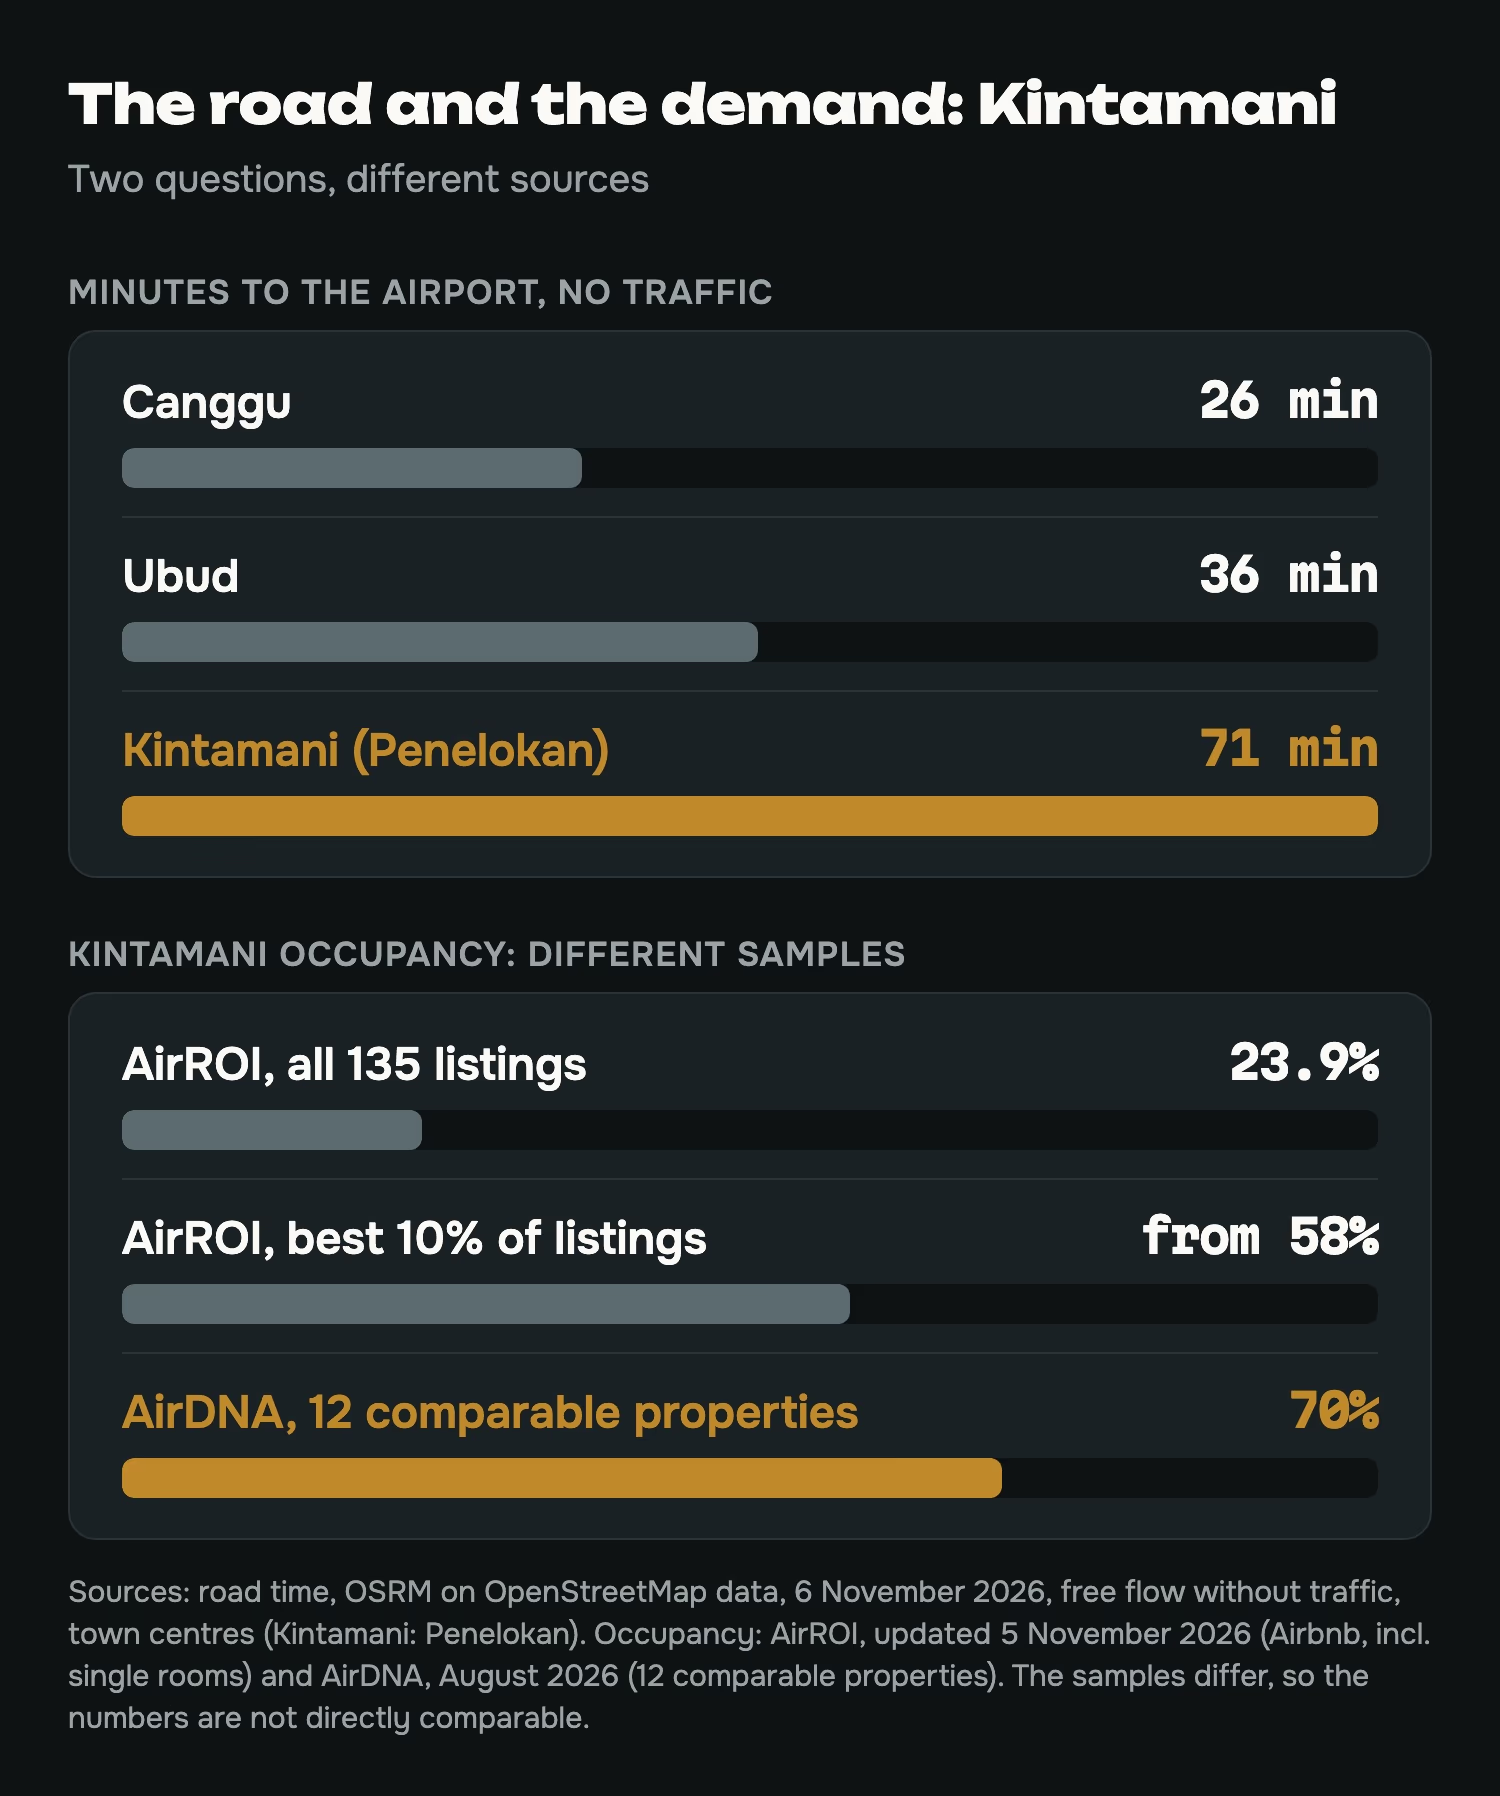
Two services measure demand in Kintamani, and their numbers differ almost threefold.
- AirROI, 5 Nov 2026: 135 listings, 23.9% occupancy, a nightly rate of about $65, revenue of about $4,700 per listing per year. Even the top 10% are booked at least 58% of nights.
- AirDNA, August 2026: an export of 12 listings similar to Nord Nest, with 70% occupancy, an average rate of $162 and $30,608 a year.
The samples differ: AirROI covers all of Airbnb, private rooms included, while AirDNA covers 12 similar cabins and villas by the caldera. So the 70% describes only those 12 listings.
The Nord Nest model targets 80% villa occupancy and a $185 rate, assumptions as of August 2026. That target sits above both samples, and we don’t promise the hotel will land among the top 10%. At 50% occupancy the model gives about 12.5% a year instead of 18.7%. The mountains also have their own seasons; see our piece on the low season in Bali.
What protects an investment: a view and a reason to come
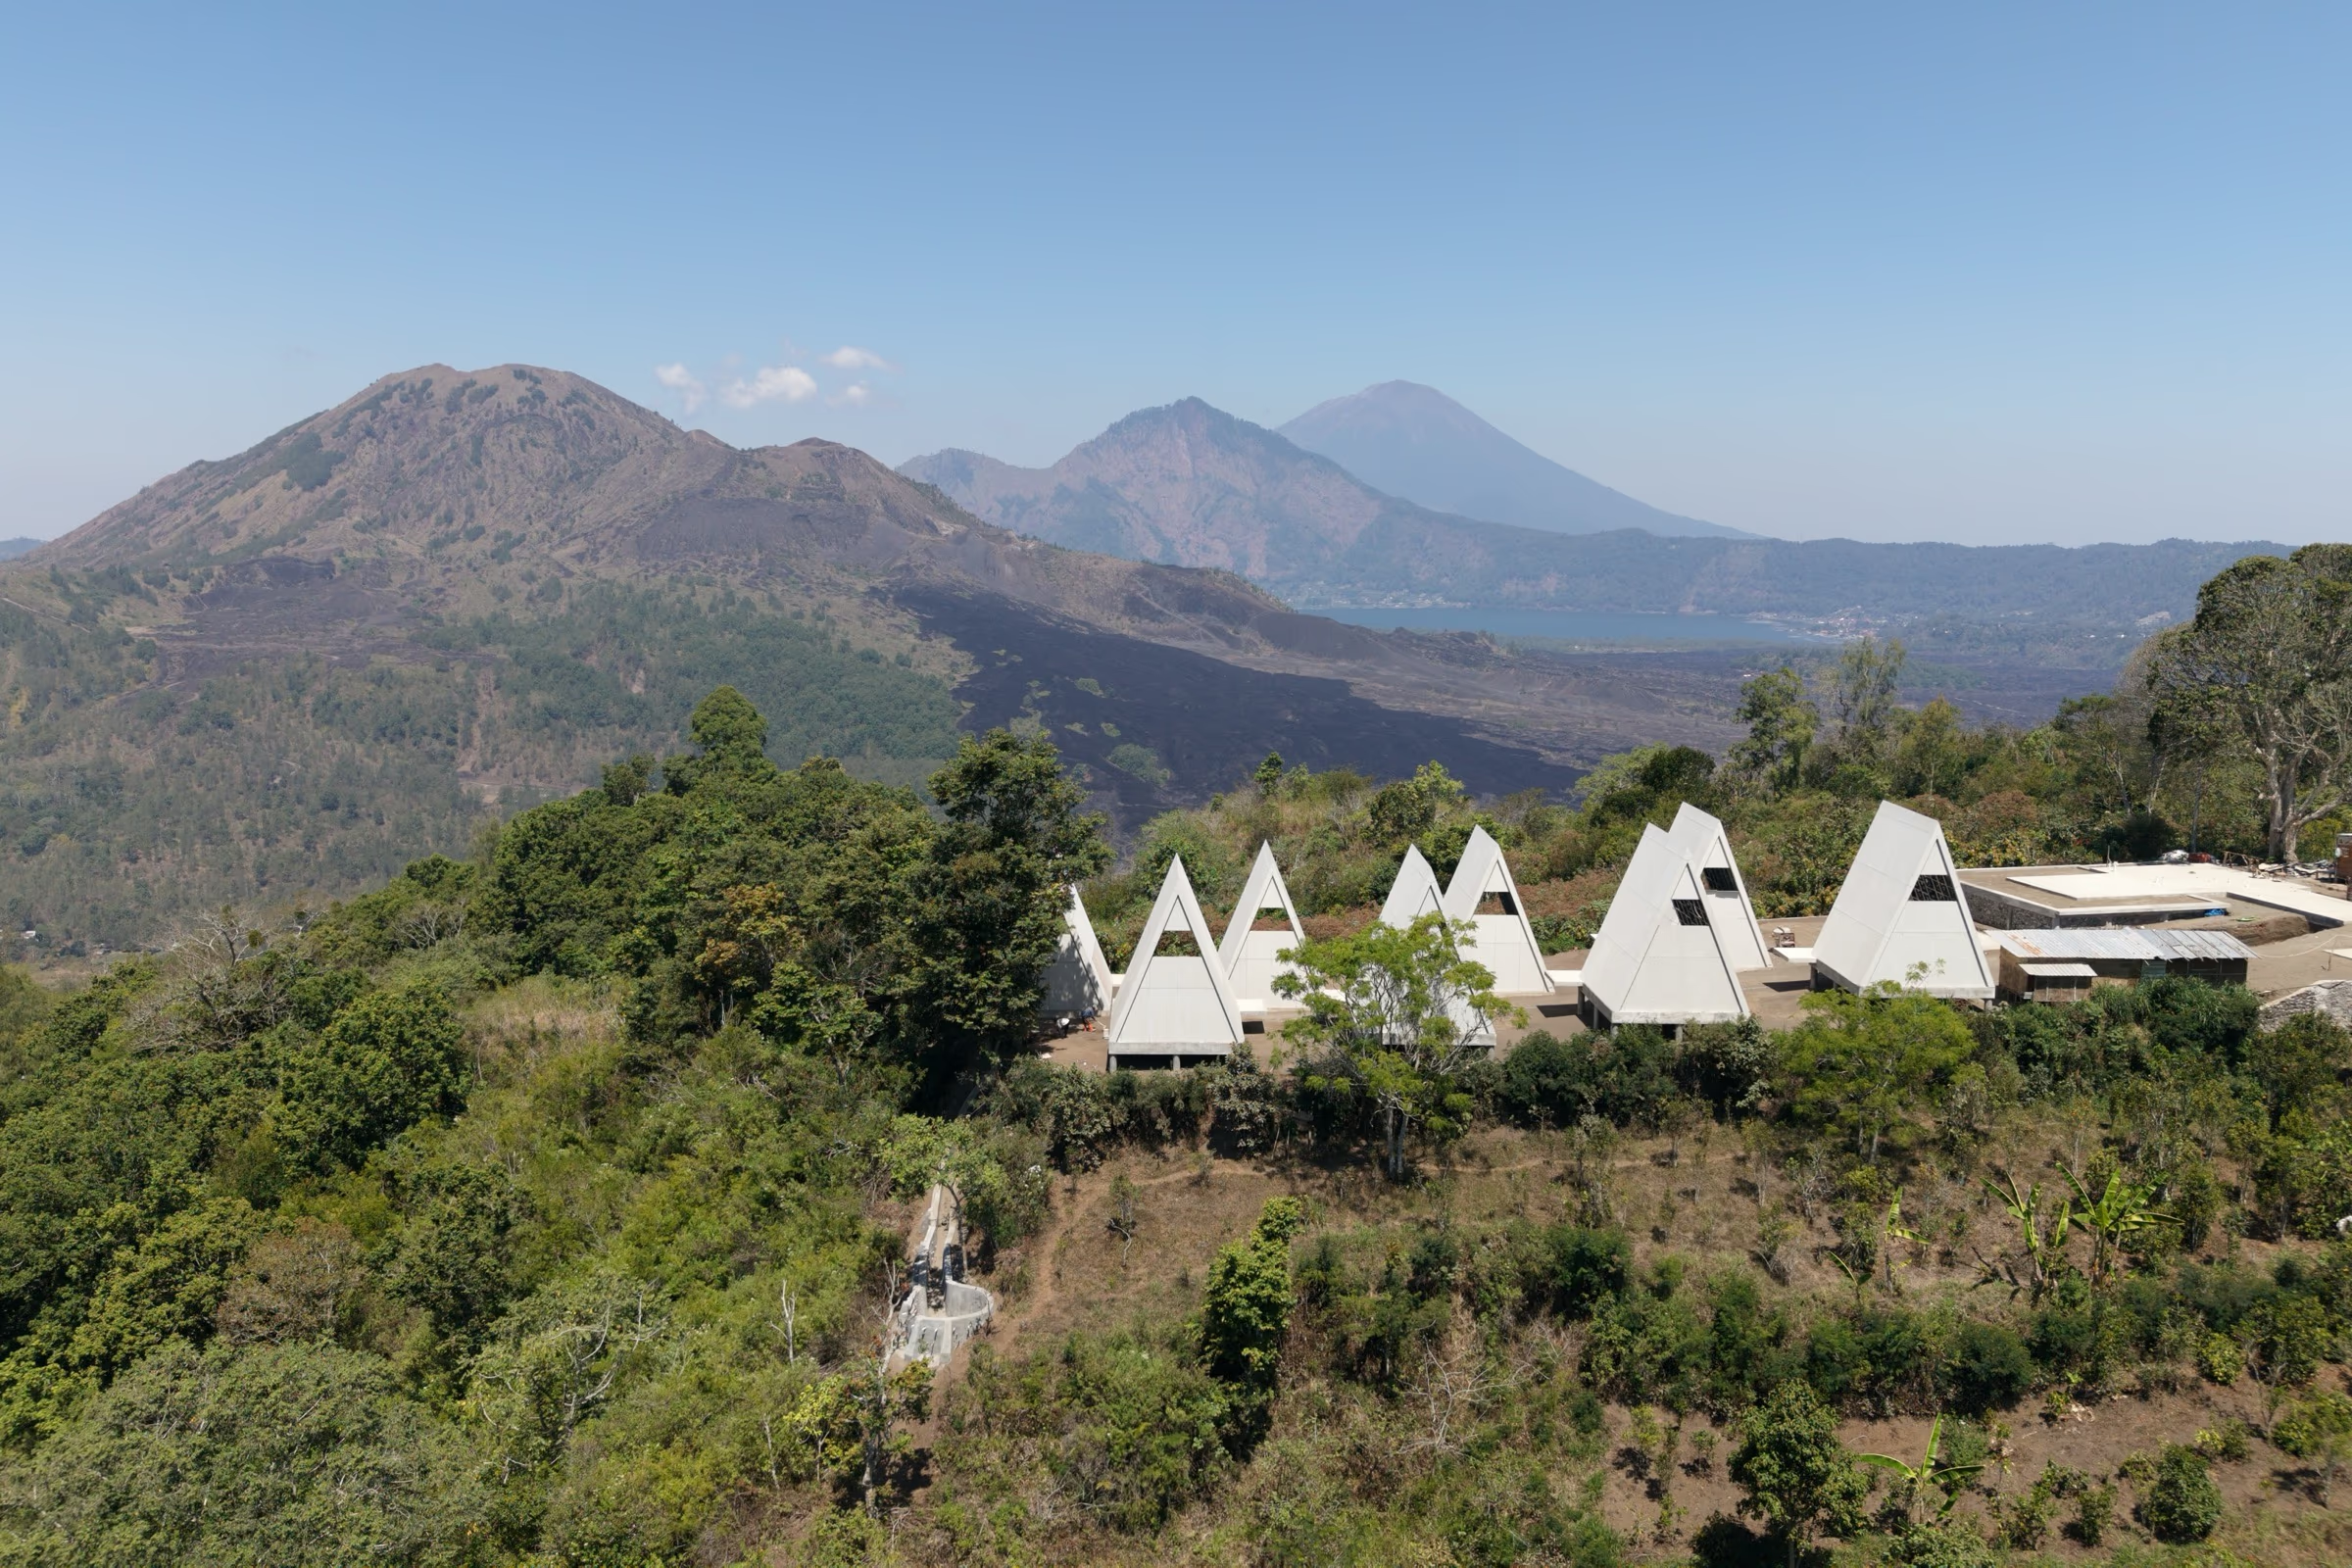
Remoteness has a cost: a longer road and lower occupancy across the area. Something has to pay that cost off, and two things can.
The first is a view that is hard to copy. Nord Nest sits on a slope above the Batur caldera, with the villas staggered so each has its own view of the volcanoes. “Nobody can build in front of it” can be said only after checking the land category of the neighbouring plots, not on a seller’s word.
The second is a reason to come. A lone cabin has only its view to attract guests. A hotel gives them more to come for: a restaurant, a spa, a bathhouse and soaking tubs (the thermal complex). In the model a 10% share earns $1,493 a month from the villas, $1,068 from the spa and thermal complex and $401 from the restaurant. Almost half the income isn’t villa nights; the model assumes 70% occupancy at the spa and 60% at the restaurant. The place gives a reason too: Batur joined the Global Geoparks Network in September 2012 (Batur UGGp report, 2021).
The full model with its assumptions is on the finance page.
FAQ
What is the best area of Bali to invest in?
There’s no single answer. The south has many listings and revenue per listing is falling (−13% to −18% over the year in Canggu, Pererenan and Pecatu). Kintamani has little competition, but the road is long and occupancy across the area is low. Look at the view, at what the property offers a guest besides a bed, and at a calculation for low occupancy.
Has building villas been banned in southern Bali?
No. A moratorium on new villas was proposed, and the governor dropped it in January 2025. What is in force is a ban on new permits for tourism properties on productive land, and it covers the whole province.
How long is the drive from Kintamani to the airport?
About 71 minutes and 78 km without traffic, by OSRM on 6 Nov 2026. From Canggu it is about 26 minutes.
What should I check before buying somewhere remote?
Occupancy of the area’s listings on Airbnb for your dates, the road to the airport, the land category of neighbouring plots, and what draws guests to the property besides the view.
Next is part three of the series: “Developer margin in real estate: what’s in the price”.